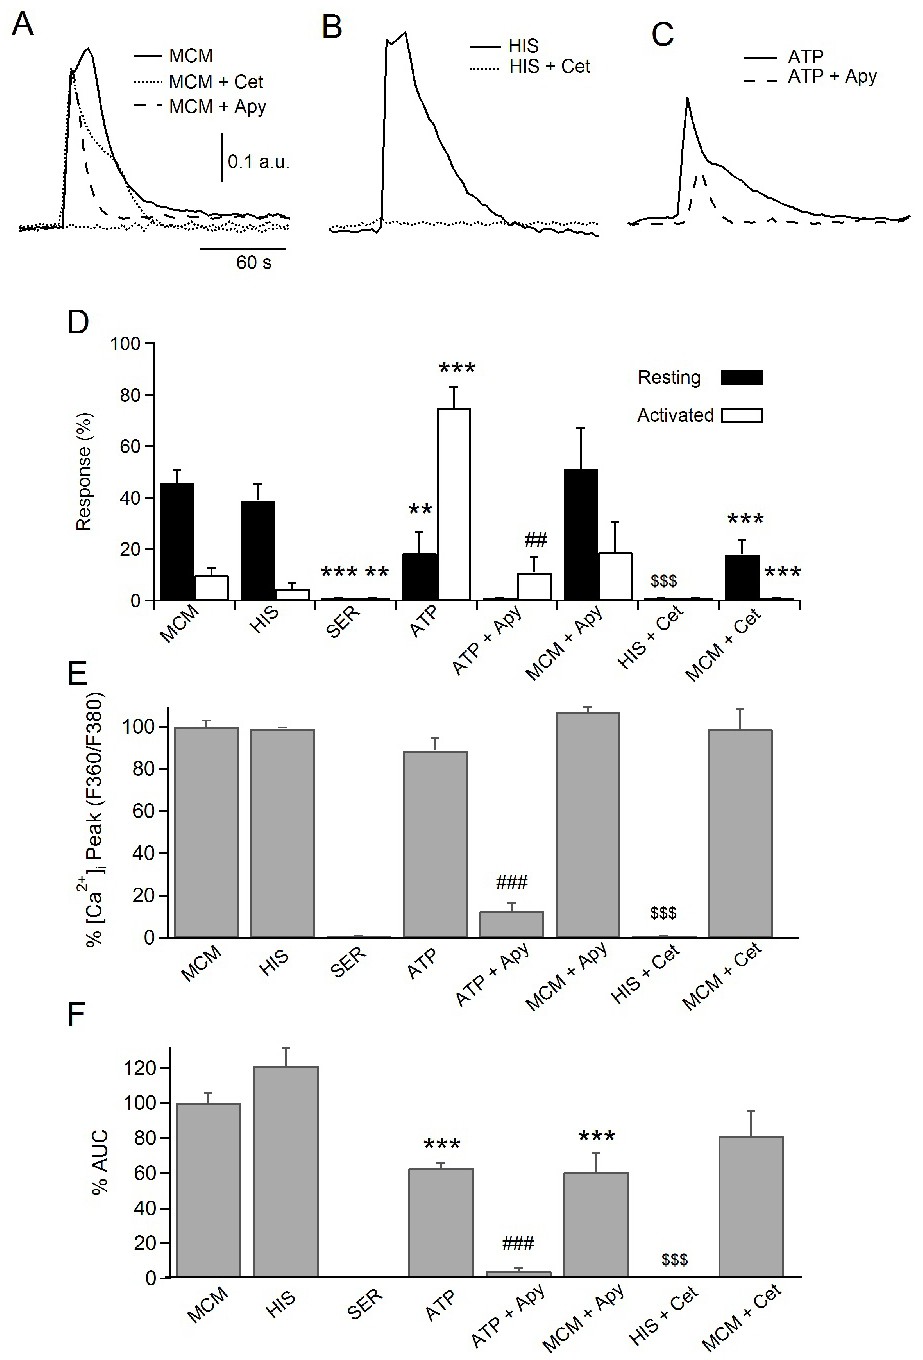
Fig. 2. Histamine and ATP contribute to outline the [Ca2+]i signal elicited by MCs mediator cocktail. A) [Ca2+]i signals evoked by single 5 s pressure ejection pulses of MCM alone (solid trace) and MCM applied after cetirizine (Cet) 1 mM (dotted line) and apyrase (Apy) 50 U/ml (dashed line) treatment (10 min). B) Representative [Ca2+]i signals evoked by histamine (HIS) 100 mM (solid line) and histamine 100 mM applied after cetirizine 1 mM (dotted line) treatment (10 min). C) Representative [Ca2+]i signals evoked by single pressure pulses of ATP 100 mM (solid line) and ATP 100 mM applied after apyrase 50 U/ml treatment (10 min) (dashed line). D) Percentage of stimulated cells which displayed [Ca2+]i transients in response to the different treatments according to the observed phenotype (resting vs activated). E) [Ca2+]i signal amplitude (peak) and F) area under curve (AUC) obtained by application of MCM, histamine 100, histamine following incubation with cetirizine (HIS + Cet), serotonin (SER), ATP, ATP after incubation with apyrase (ATP + Apy), MCM after incubation with cetirizine (MCM + Cet) and MCM after incubation with apyrase (MCM + Apy) are presented as % of means ± SEM. Data were normalized regarding the MCM response. Statistically significant from MCM-treated cells (***p<0.001, **p<0.01). Statistically significant from ATP-treated cells (###p<0.001, ##p<0.01). Statistically significant from histamine-treated cells ($$$p<0.001), using Mann-Whitney Rank Sum test.